this is a background page with blue dot

Hello, I’m Yilin Xia

I am a Ph.D. student advised by Dr. Bertram Ludäscher and Dr. Matthew Turk in the School of Information Sciences at the University of Illinois at Urbana-Champaign. I also work closely with Dr. Shawn Bowers , Dr. Evgeny Skvortsov and ArviZ Team. Additionally, my research benefits from collaborations with researchers & engineers at Microsoft Research, the CYENS Centre of Excellence and Open Source Communities.


My research focuses on Declarative Data Science & AI, where I address real-world data challenges through a declarative approach. I am broadly interested in data management, data visualization, and knowledge representation & reasoning, with a goal of making data-driven insights more accessible, explainable, and user-friendly. My areas of interest include:
  • Declarative AI (aka Symbolic AI): Multimodal Application
  • Declarative Query Language: Query Explanation and Evaluation
  • Declarative Visualization: Visualization Formalization and Construction


In my spare time, I'm deeply interested in the arts, like painting and photography. I also enjoy sports such as badminton icon badminton,   hiking,   skiing and   running.


Profile Image and My Procreate Arts


Name Pronunciation


Ph.D. Student @UIUC


Featured Publications


COMMA 2024 Publication
COMMA'24

Layered Visualization of Argumentation Frameworks

Yilin Xia, Daphne Odekerken, Shawn Bowers, Bertram Ludäscher

EDBT 2024 Publication
EDBT'24

Logica: Declarative Data Science for Mere Mortals

Evgeny Skvortsov, Yilin Xia, Bertram Ludäscher

CHI 2024 Publication
CHI'24

MAIDR: Making Statistical Visualizations Accessible with Multimodal Data Representation

JooYoung Seo*, Yilin Xia*, Bongshin Lee, Sean McCurry, Yu Jun Yam

IDCC 2024 Publication
IDCC'24

Reconciling Conflicting Data Curation Actions: Transparency Through Argumentation

Yilin Xia, Shawn Bowers, Lan Li, Bertram Ludäscher

CHI 2023 Publication
CHI'23

CrowdIDEA: Blending Crowd Intelligence and Data Analytics to Empower Causal Reasoning

Chi-Hsien (Eric) Yen, Haocong Cheng, Yilin Xia, Yun Huang


Latest News


Sept, 2024    We got two papers on Logica accepted by ICLP workshops Datalog2.0 & PEG
July, 2024    Attended SciPy'24 and presented two posters on JupyterLab NodeEditor (JLNE) and Arviz Dashboard
June, 2024    Our demo paper "Layered Visualization of Argumentation Frameworks" accepted for COMMA 2024
Feb, 2024    Our demo paper "Logica: Declarative Data Science for Mere Mortals" accepted for EDBT 2024
Jan, 2024    Our paper "MAIDR: Making Statistical Visualizations Accessible with Multimodal Data Representation" has been accepted for CHI 2024
Dec, 2023    Our manuscript "Reconciling Conflicting Data Curation Actions: Transparency Through Argumentation" has been accepted for IDCC 2024
Nov, 2023    Received $10,000 funding from NumFOCUS to work on project "Dashboard-assisted exploratory analysis of Bayesian models"
Nov, 2023    Our work "Games, Queries, and Argumentation Frameworks: Time for a Family Reunion!" has been accepted to AI^3 at AIxIA
Oct, 2023    Awarded $1,000 Conference Travel Grant from United States Research Software Engineer Association(US-RSE)

Featured Projects


This is a graph from the paper where it indicates how similar the argumentation and game theory are
Logica
Query Language; Logic Programming; Reasoning

Logica is a logic programming language that compiles to SQL. It runs on Google BigQuery, PostgreSQL and SQLite.

This is a graph from the paper where it indicates how similar the argumentation and game theory are
gamearg
Rule-based Reasoning; Explanation; Argumentation

By using logic programming and data visualization, gamearg help explain the status of argument and reasoning process.

MAIDR interface with a braille display on the side
MAIDR
Visualization Construction; Accessibility

MAIDR offers non-visual access to statistical visualizations for users with visual impairments. It supports interaction through braille, text, sonification, and review (BTS + R).

Jupyterlab NodeEditor Logo
Jupyterlab NodeEditor
End-user Programming; Scientific Computing

A graphical user interface using a dataflow-driven visual programming language to enhance data science tasks. It provides domain experts with intuitive tools for complex data workflow.

ArviZ Logo
ArviZ Dashboard
Dashboards; Statistics; Model Comparison

Designed for Bayesian statisticians, this project transforms static visualizations into interactive dashboards with tools like Panel and Bokeh. It enables dynamic model comparison within a unified interface.
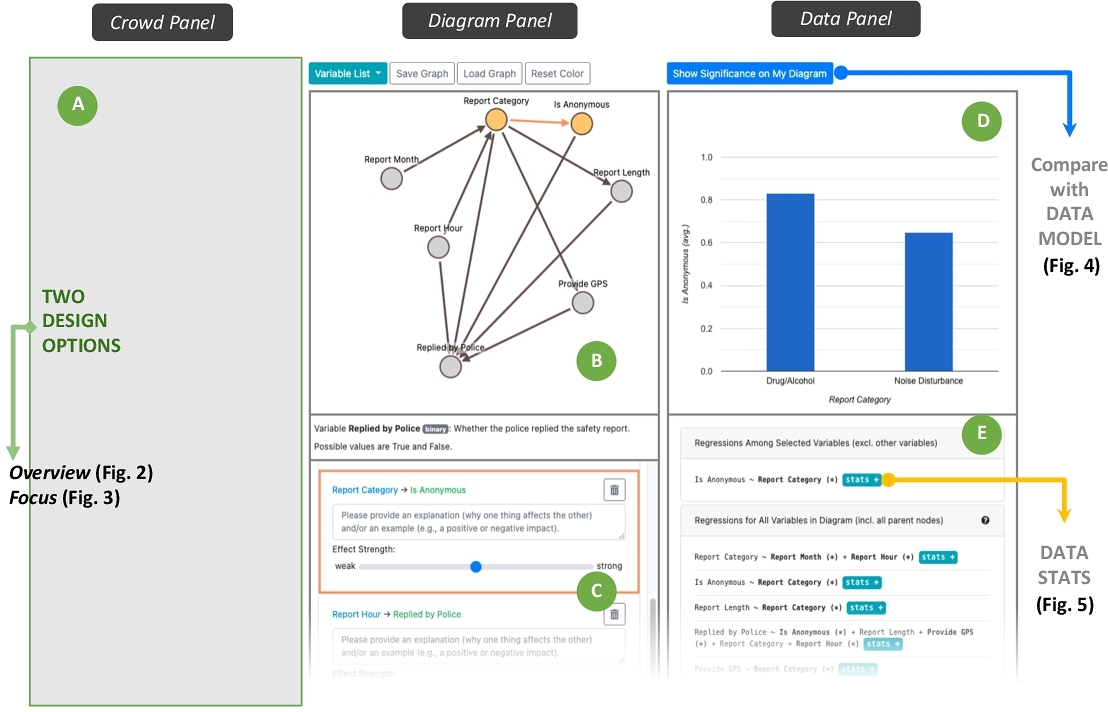
CrowdIDEA Interface
CrowdIDEA
Visualization; Causal Reasoning

CrowdIDEA integrates crowd beliefs, data analytics, and causal diagrams into a tool for stimulating causal reasoning. Its design encourages exploration of causal relationships using collective insights